When You Flush The CodeCache
- Jan 26, 2019
- 2 min read
Updated: Mar 12, 2024
In the previous blog post, I wrote about our problem with JVM CodeCache. This cache is used for saving compiled machine code and if your Java application generates new code on the fly, it will eventually fill.
In our case, it filled pretty quickly with code, which was very soon obsolete. The profiling showed that when the cache filled up, it didn't flush. This shut down compilers which resulted in performance degradation.
After some time, I came back to the problem and solved it. I can't remember now if I tried at that time the most obvious thing - turn on the flushing. I probably did it but because some cache cleanups were visible before it filled, it's possible I convinced myself the flushing is happening and I didn't turn it on. Anyway, let me describe you all steps which, at the end of the day, helped us.
As I wrote before, we are using Janino compiler to compile many generated classes. Janino was defined as a singleton in our application. My idea was, that machine code is maybe stuck in CodeCache because compiled classes are never freed by a garbage collector. I still don't know if the idea is correct but it's still a memory leak no matter what. Compiled classes are stored in ClassLoader inside compiler instance and this instance lives through the whole application lifetime. It's maybe not a big issue if you have a lot of memory but I still create the instance of a compiler for each compilation as the performance hit isn't big in our case.
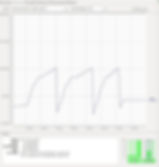
And of course, the flushing has to be on manually (-XX:+UseCodeCacheFlushing) because it's not active by default. After this, I finally saw the "saw" in a plot. Interesting thing is, that after the second peak, I still observed the error in the log that compilers were turned off. Even though the cache was flushed. It's possible they were started later and this wasn't logged but because it happened only once and I don't want to invest more time to this problem, I'm happy with what we have now.


.png)